on
Instrumenting a Marten App with OpenTelemetry

Instrumenting a Marten App with OpenTelemetry
This article demonstrates how to instrument a Crystal application using OpenTelemetry with the Marten web framework1. It begins with a basic setup, covers visualizing traces in Jaeger, and introduces HTTP request tracing using middleware. After it connects two services and propagating trace context between them to build a complete distributed trace.
1. Project Setup
Begin by creating a new Marten application named DrukArmy (inspired by https://drukarmy.org.ua/en):
marten new project drukarmy
cd drukarmy
Add the opentelemetry-sdk2 shard to the shard.yml:
# shard.yml
dependencies:
  ...
  opentelemetry-sdk:
    github: wyhaines/opentelemetry-sdk.cr
Next, create an initializer in config/initializers/opentelemetry.cr to configure the OpenTelemetry SDK.
To verify that the setup is working, emit a test span:
# config/initializers/opentelemetry.cr
require "opentelemetry-sdk"

OpenTelemetry.configure do |config|
  config.service_name = "drukarmy"
  config.exporter = OpenTelemetry::Exporter.new(variant: :stdout)
end

OpenTelemetry.tracer.in_span("startup") do |root_span|
  root_span.consumer!
end
Run the server to confirm that spans are being emitted:
marten serve
You should see a span named startup printed to the terminal.
{
  "type": "trace",
  "traceId": "2bc89670000edfb4dab7470af935d3e9",
  "resource": {
    "service.name": "drukarmy",
    ...
  },
  "spans": [
    {
      "type": "span",
      "traceId": "2bc89670000edfb4dab7470af935d3e9",
      "spanId": "0edfb4dab7000001",
      "name": "startup",
      ...
    }
  ]
}
2. Viewing Traces
To make this more useful, let’s view spans in Jaeger3, a lightweight UI for working with trace data. Run Jaeger in a container:
docker run --rm -p 16686:16686 -p 4318:4318 quay.io/jaegertracing/jaeger:2.6.0
Next, update the OpenTelemetry configuration to use the http exporter instead of stdout:
# config/initializers/opentelemetry.cr
require "opentelemetry-sdk"

OpenTelemetry.configure do |config|
	config.service_name = "drukarmy"
	config.exporter = OpenTelemetry::Exporter.new(variant: :http) # changed from :stdout
end

OpenTelemetry.tracer.in_span("startup") do |root_span|
  root_span.consumer!
end
This configuration sends spans to the default HTTP endpoint: http://localhost:4318/v1/traces.
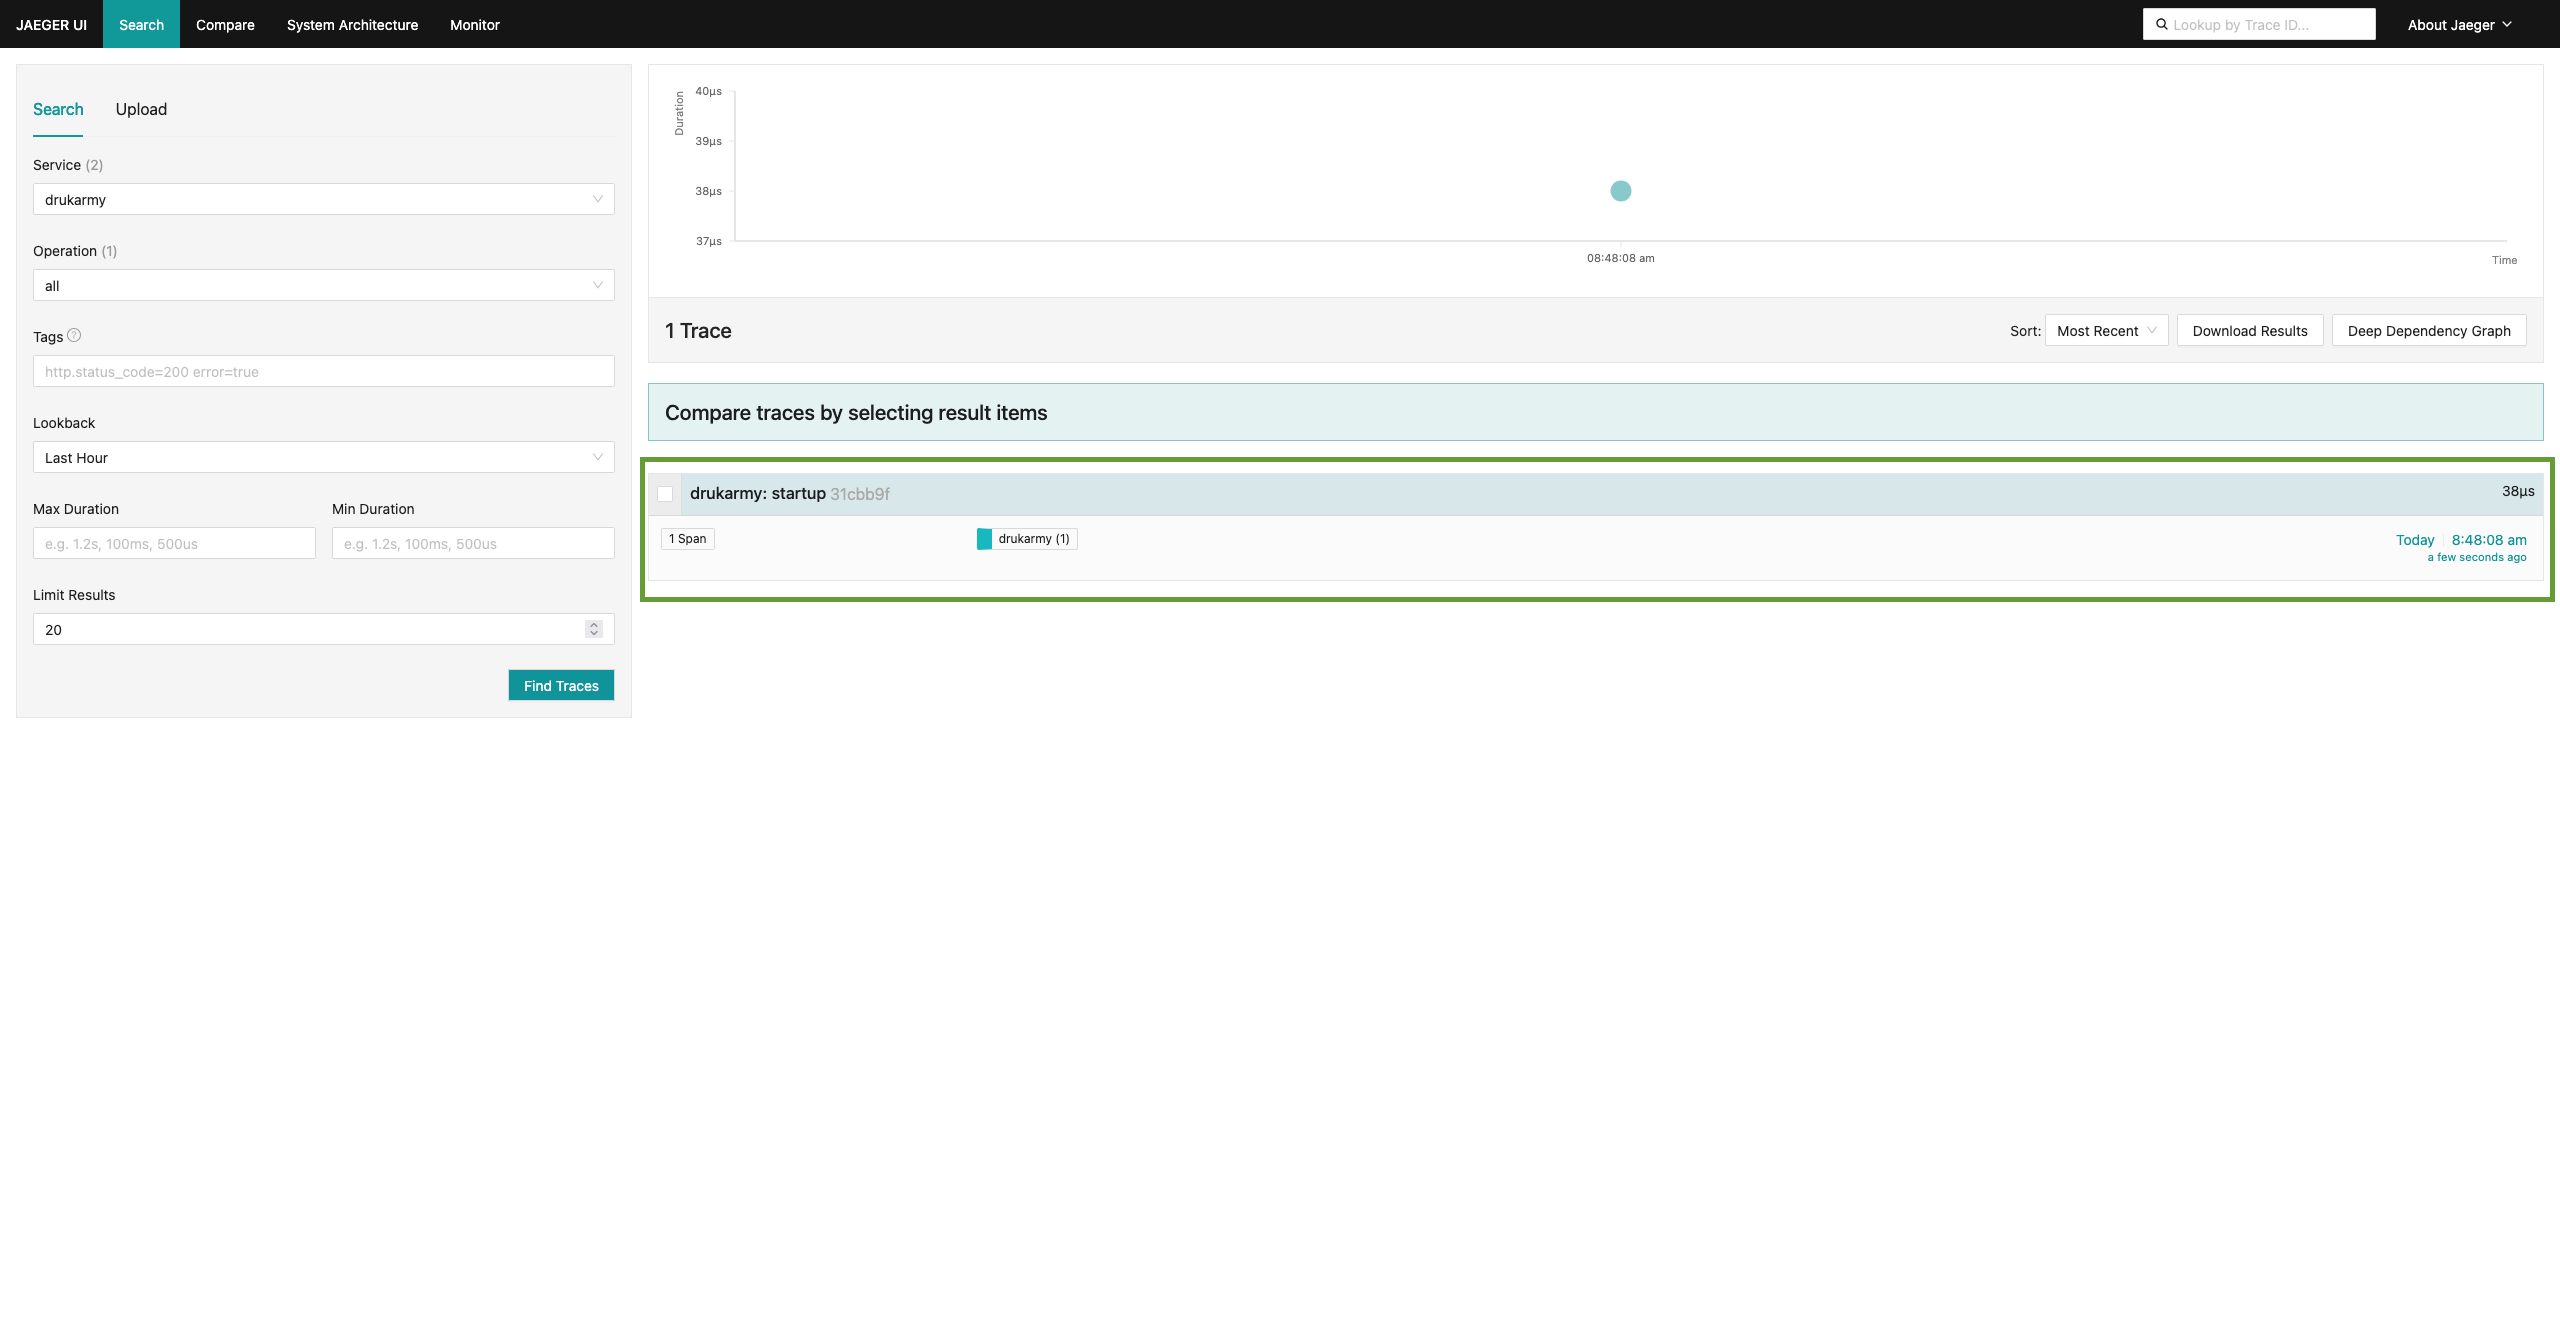
Visit the Jaeger UI to explore the emitted traces.
[!TIP] Set the
DEBUG=1environment variable to enable more verbose logging from the OpenTelemetry library.
3. Instrumenting HTTP Requests
3.1 Add a Middleware
To trace incoming HTTP requests, you can use a Marten middleware4, which allows you to insert tracing logic around request handling.
For reference, other frameworks also offer OpenTelemetry instrumentation libraries, which may serve as inspiration5.
Create a middleware for tracing. For simplicity, place it alongside other handlers:
# src/handlers/opentelemetry_middleware.cr
class OpenTelemetryMiddleware < Marten::Middleware
  def call(request : Marten::HTTP::Request, get_response : Proc(Marten::HTTP::Response)) : Marten::HTTP::Response
    ::OpenTelemetry.tracer.in_span("process_request") do |span|
      span.server!
      # Add standard HTTP attributes
      span["http.request.method"] = request.method
      span["url.path"] = request.path

      response = get_response.call
      span["http.response.status_code"] = response.status
      response
    end
  end
end
Marten’s request and response APIs are described in the official documentation6.
The attributes above follow OpenTelemetry’s semantic conventions for HTTP spans7.
Register the middleware in config/settings/base.cr, placing it at the top of the middleware stack:
Marten.configure do |config|
  ...
  config.middleware = [
    OpenTelemetryMiddleware,
    ...
  ]
  ...
end
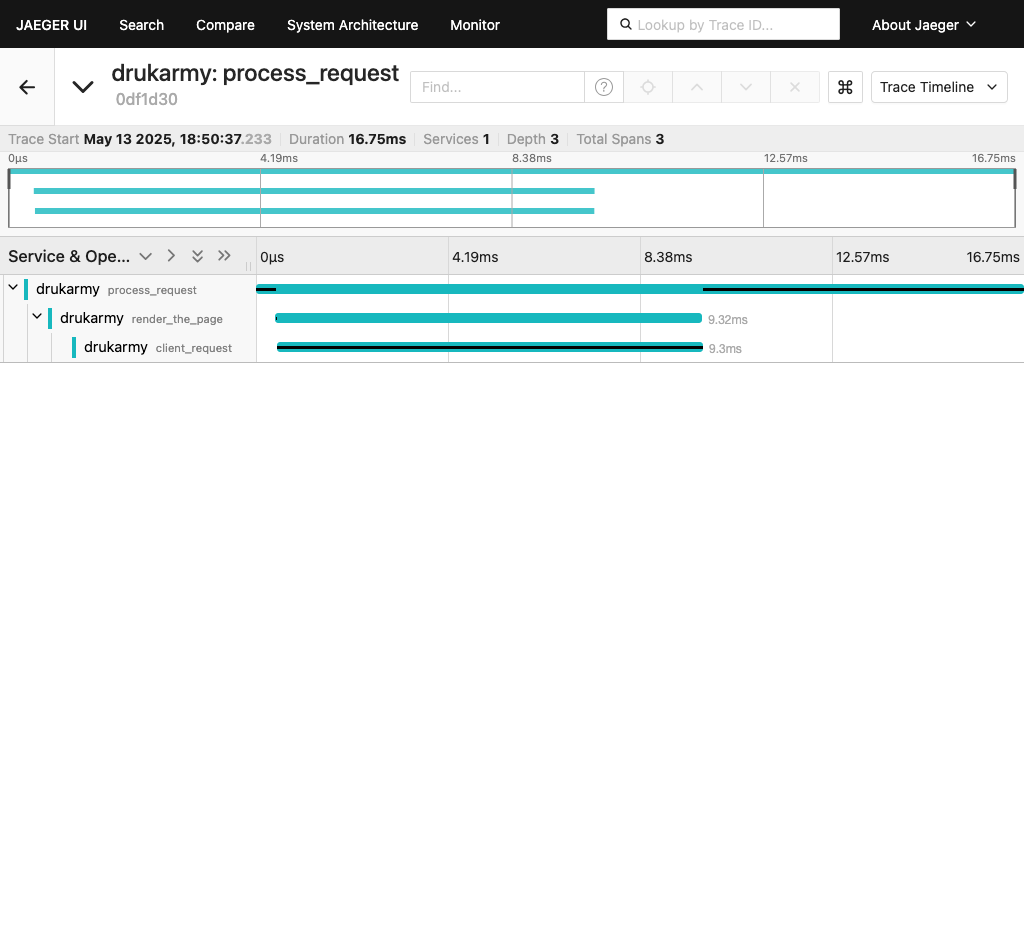
After adding the middleware, check the Jaeger UI to confirm that HTTP request traces are being captured.
3.2 Create a Sample Handler
Next, define a basic handler to test HTTP request tracing:
# src/handlers/home_handler.cr
class HomeHandler < Marten::Handler
  def get
    ::OpenTelemetry.tracer.in_span("render_the_page") do |span|
      span.set_attribute("custom_logic", "true")
      respond %[{"message": "Hello!"}]
    end
  end
end
Update the route configuration to map the root path to the handler:
# config/routes.cr
Marten.routes.draw do
  path "/", HomeHandler, name: "home"
  ...
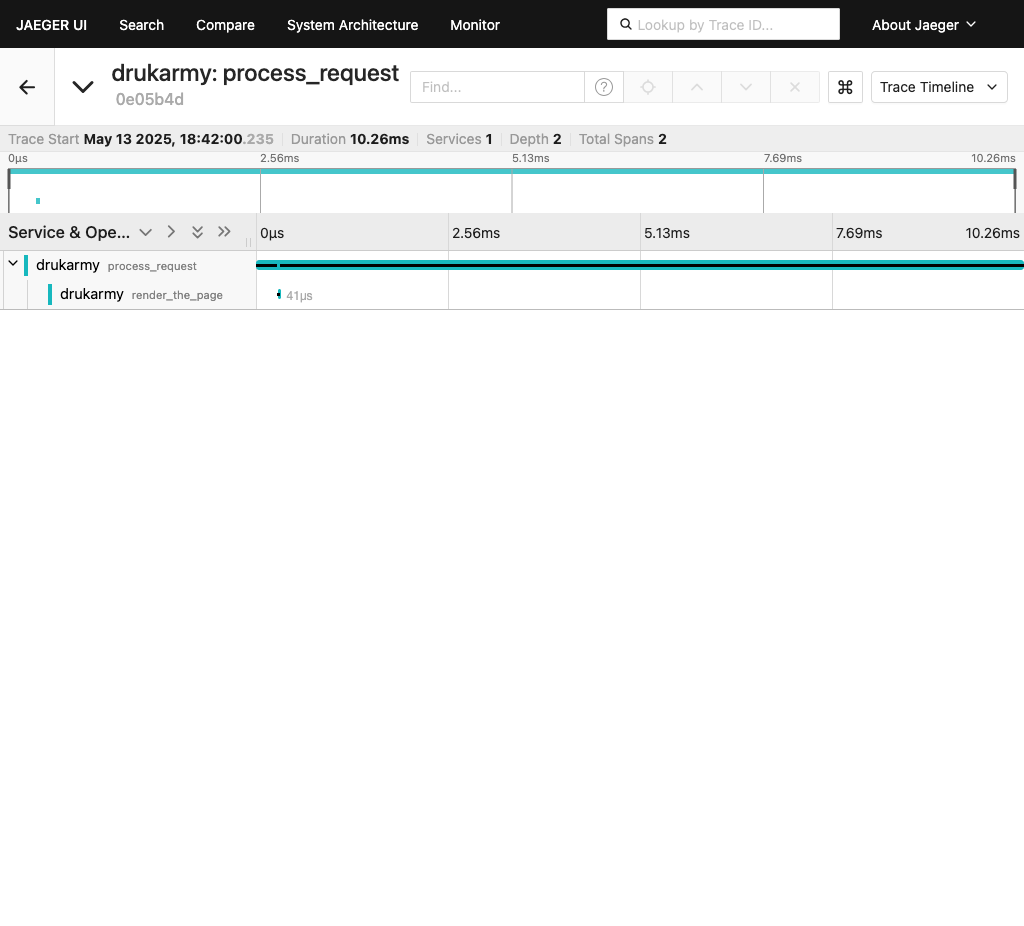
Now, when you visit http://localhost:8000/ (e.g curl localhost:8000), a span named render_the_page will appear in Jaeger.
At this point, you should be able to explore how a single application can generate traces and visualize them using Jaeger.
4. Distributed Tracing
One of the key benefits of OpenTelemetry is the ability to correlate telemetry data across multiple services involved in handling the same request.
To demonstrate this, we’ll set up a second application and observe how traces from both services can be linked together.
The following diagram outlines the interaction between two applications and the expected trace behavior:
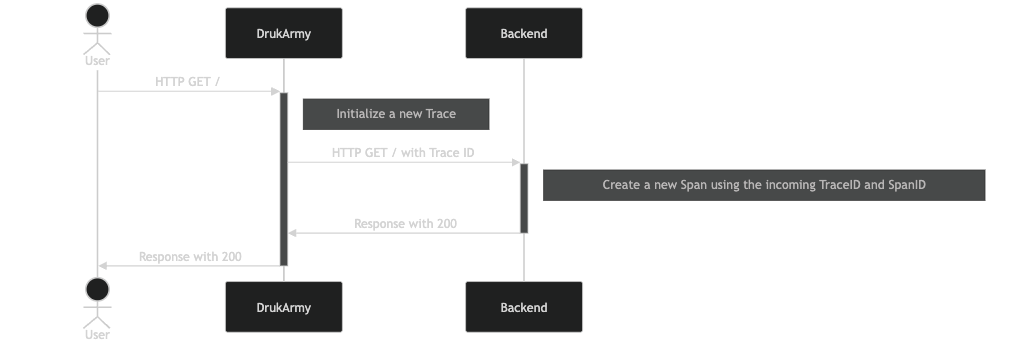
Spans across services are connected using a shared TraceID. Additionally, the parent SpanID helps define the relationship and order of spans within the trace:
request (SERVER, trace=t1, span=s1, service=drukarmy)
  |
  -- GET /backend - 200 (CLIENT, trace=t1, span=s2, parent=s1, service=drukarmy)
      |
      --- server (SERVER, trace=t1, span=s3, parent=s2, service=backend)
In the next steps, we’ll build and connect two services and propagate the tracing context between them.
4.1. Set Up a Second App
To simulate a multi-service environment, duplicate the existing application to serve as a second service:
cd ..
cp -a drukarmy backend
cd backend
Update the service name and port to allow both applications to run concurrently:
# <backend>/config/initializers/opentelemetry.cr
require "opentelemetry-sdk"

OpenTelemetry.configure do |config|
  config.service_name = "backend" # changed from "drukarmy"
  config.exporter = OpenTelemetry::Exporter.new(variant: :http)
end
...
# <backend>/config/settings/development.cr
Marten.configure :development do |config|
  config.debug = true
  config.host = "127.0.0.1"
  config.port = 8001 # changed from 8000
end
Create a dedicated handler for this service:
# <backend>/src/handlers/backend_handler.cr
class BackendHandler < Marten::Handler
  def get
    OpenTelemetry.in_span("backend_process") do |span|
      respond %[{"message": "Hello from Backend"}]
    end
  end
end
Update the routes accordingly:
# <backend>/config/routes.cr
Marten.routes.draw do
  path "/backend", BackendHandler, name: "backend"
  ...
end
Now run the second application:
marten serve
You should now have two services running:
drukarmyon port 8000backendon port 8001
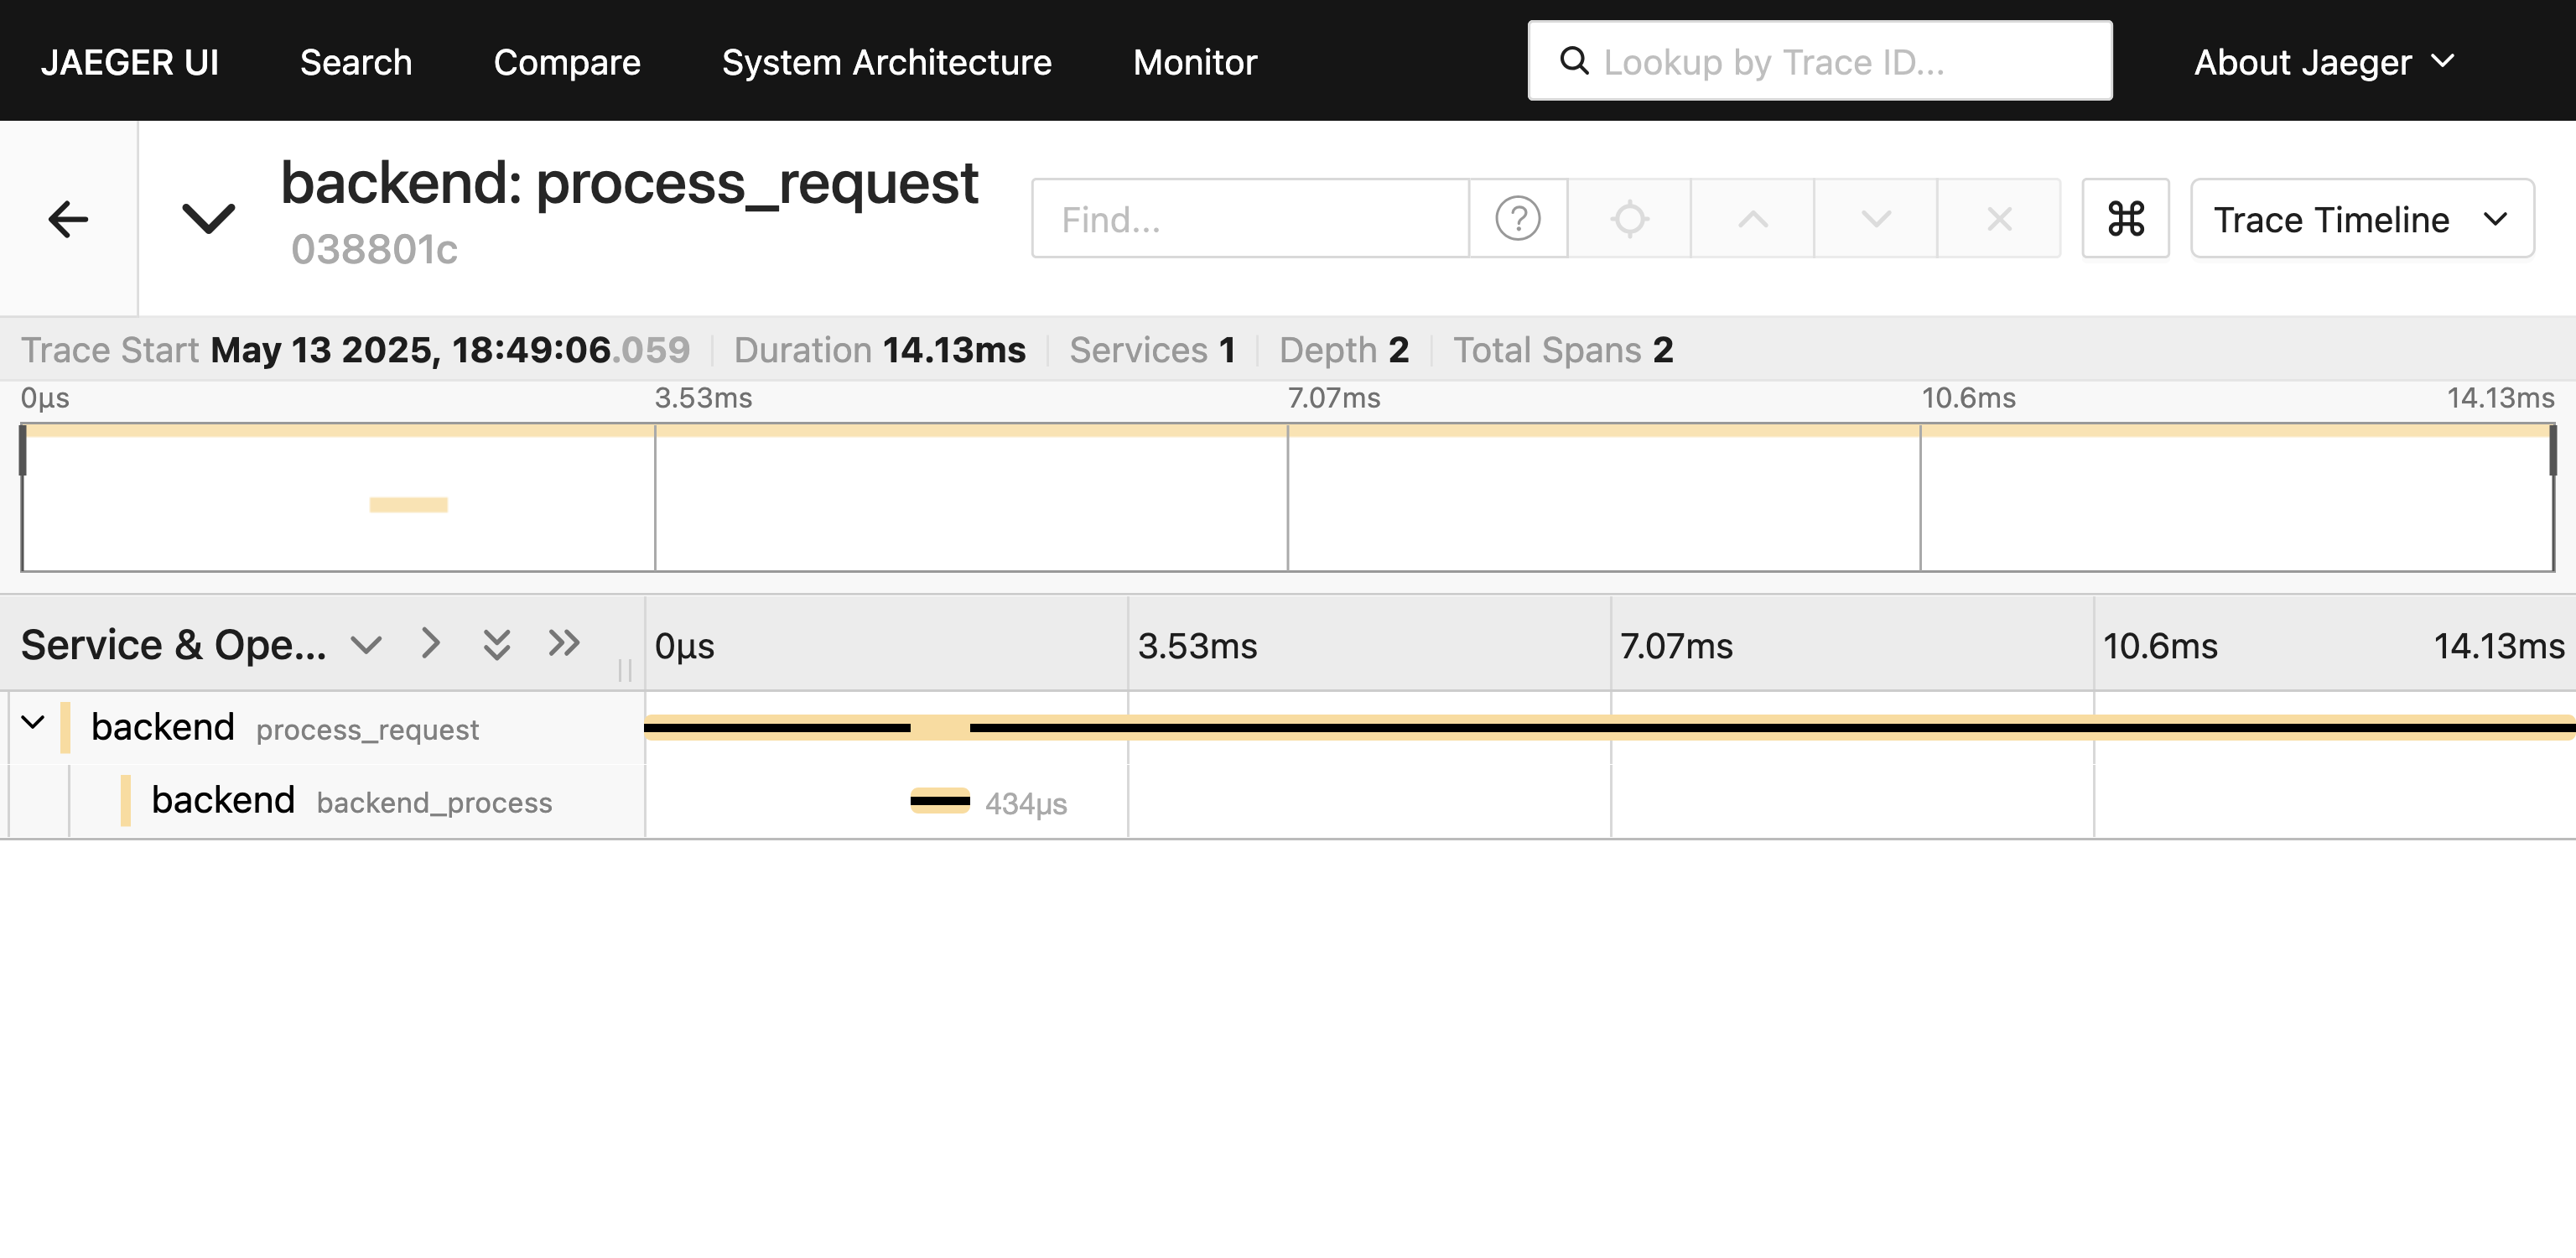
You can test the backend app and then validate the spans in the Jaeger UI by running:
$ curl localhost:8001/backend
{"message": "Hello from Backend"}
4.2. Chain of HTTP Calls
Update the HomeHandler in the original drukarmy application to make an outgoing HTTP request
to the backend service and propagate the tracing context:
# <drukarmy>/src/handlers/home_handler.cr
class HomeHandler < Marten::Handler
  def dispatch
    ::OpenTelemetry.tracer.in_span("render_the_page") do |span|
      respond client_request
    end
  end

  def client_request
    ::OpenTelemetry.tracer.in_span("client_request") do |span|
      span.client!
      url = "http://localhost:8001/backend"
      span["url.full"] = url

      headers = HTTP::Headers.new

      # Propagate the trace context via HTTP headers
      OpenTelemetry::Propagation::TraceContext.new(span.context).inject(headers)

      response = HTTP::Client.get url, headers: headers
      span["http.response.status_code"] = response.status_code
      if response.status_code != 200
        span.status.error!("Error: #{response.status_code}")
      end
      response.body
    end
  rescue ex : Socket::ConnectError
    %[{"error": Something goes wrong"}]
  end
end
This handler does two things:
- It starts a span for the incoming request (
render_the_page). - It performs an outgoing HTTP request to the
backendservice within a child span (client_request).
The key detail here is the use of OpenTelemetry::Propagation::TraceContext,
which injects the trace and span identifiers into the request headers.
This allows the backend service to associate its span with the same trace.
This mechanism is based on the “W3C Trace Context specification”8,
which defines how trace context should be propagated using standard HTTP headers like traceparent and tracestate.
4.3. Receive Trace Context in Backend
In the previous step, we propagated the trace context from the drukarmy app to the backend app.
However, the backend service still needs to extract and respect that context in order to properly link its span to the original trace.
To do this, update the OpenTelemetry middleware in both applications to extract the context using OpenTelemetry::Propagation::TraceContext:
# <drukarmy>/src/handlers/opentelemetry_middleware.cr
# <backend>/src/handlers/opentelemetry_middleware.cr

class OpenTelemetryMiddleware < Marten::Middleware
  def call(request : Marten::HTTP::Request, get_response : Proc(Marten::HTTP::Response)) : Marten::HTTP::Response
    trace = ::OpenTelemetry.trace
    traceparent_header = request.headers["traceparent"]?

    # Extract and assign trace_id from headers
    if traceparent_header
      traceparent = ::OpenTelemetry::Propagation::TraceContext::TraceParent.from_string(traceparent_header)
      trace.trace_id = traceparent.trace_id
      trace.span_context.trace_id = traceparent.trace_id
    end

    trace.in_span("process_request") do |span|
      span.server!

      # Reconstruct parent span and span context if traceparent header is present
      if traceparent_header
        parent_span = ::OpenTelemetry::Span.build("Phantom Parent") do |pspan|
          pspan.is_recording = false
          pspan.context = ::OpenTelemetry::Propagation::TraceContext.new(span.context).extract(request.headers).as(::OpenTelemetry::SpanContext)

          # Prevent duplicate propagation
          request.headers.delete("traceparent")
          request.headers.delete("tracestate")
        end
        span.parent = parent_span if parent_span
      end

      # Add standard HTTP attributes
      span["http.request.method"] = request.method
      span["url.path"] = request.path

      response = get_response.call
      span["http.response.status_code"] = response.status
      response
    end
  end
end
This middleware:
- Extracts the
traceparentheader and sets the trace ID. - Reconstructs the parent span from the incoming context.
- Starts a server span that now belongs to the same trace as the original request in
drukarmy.
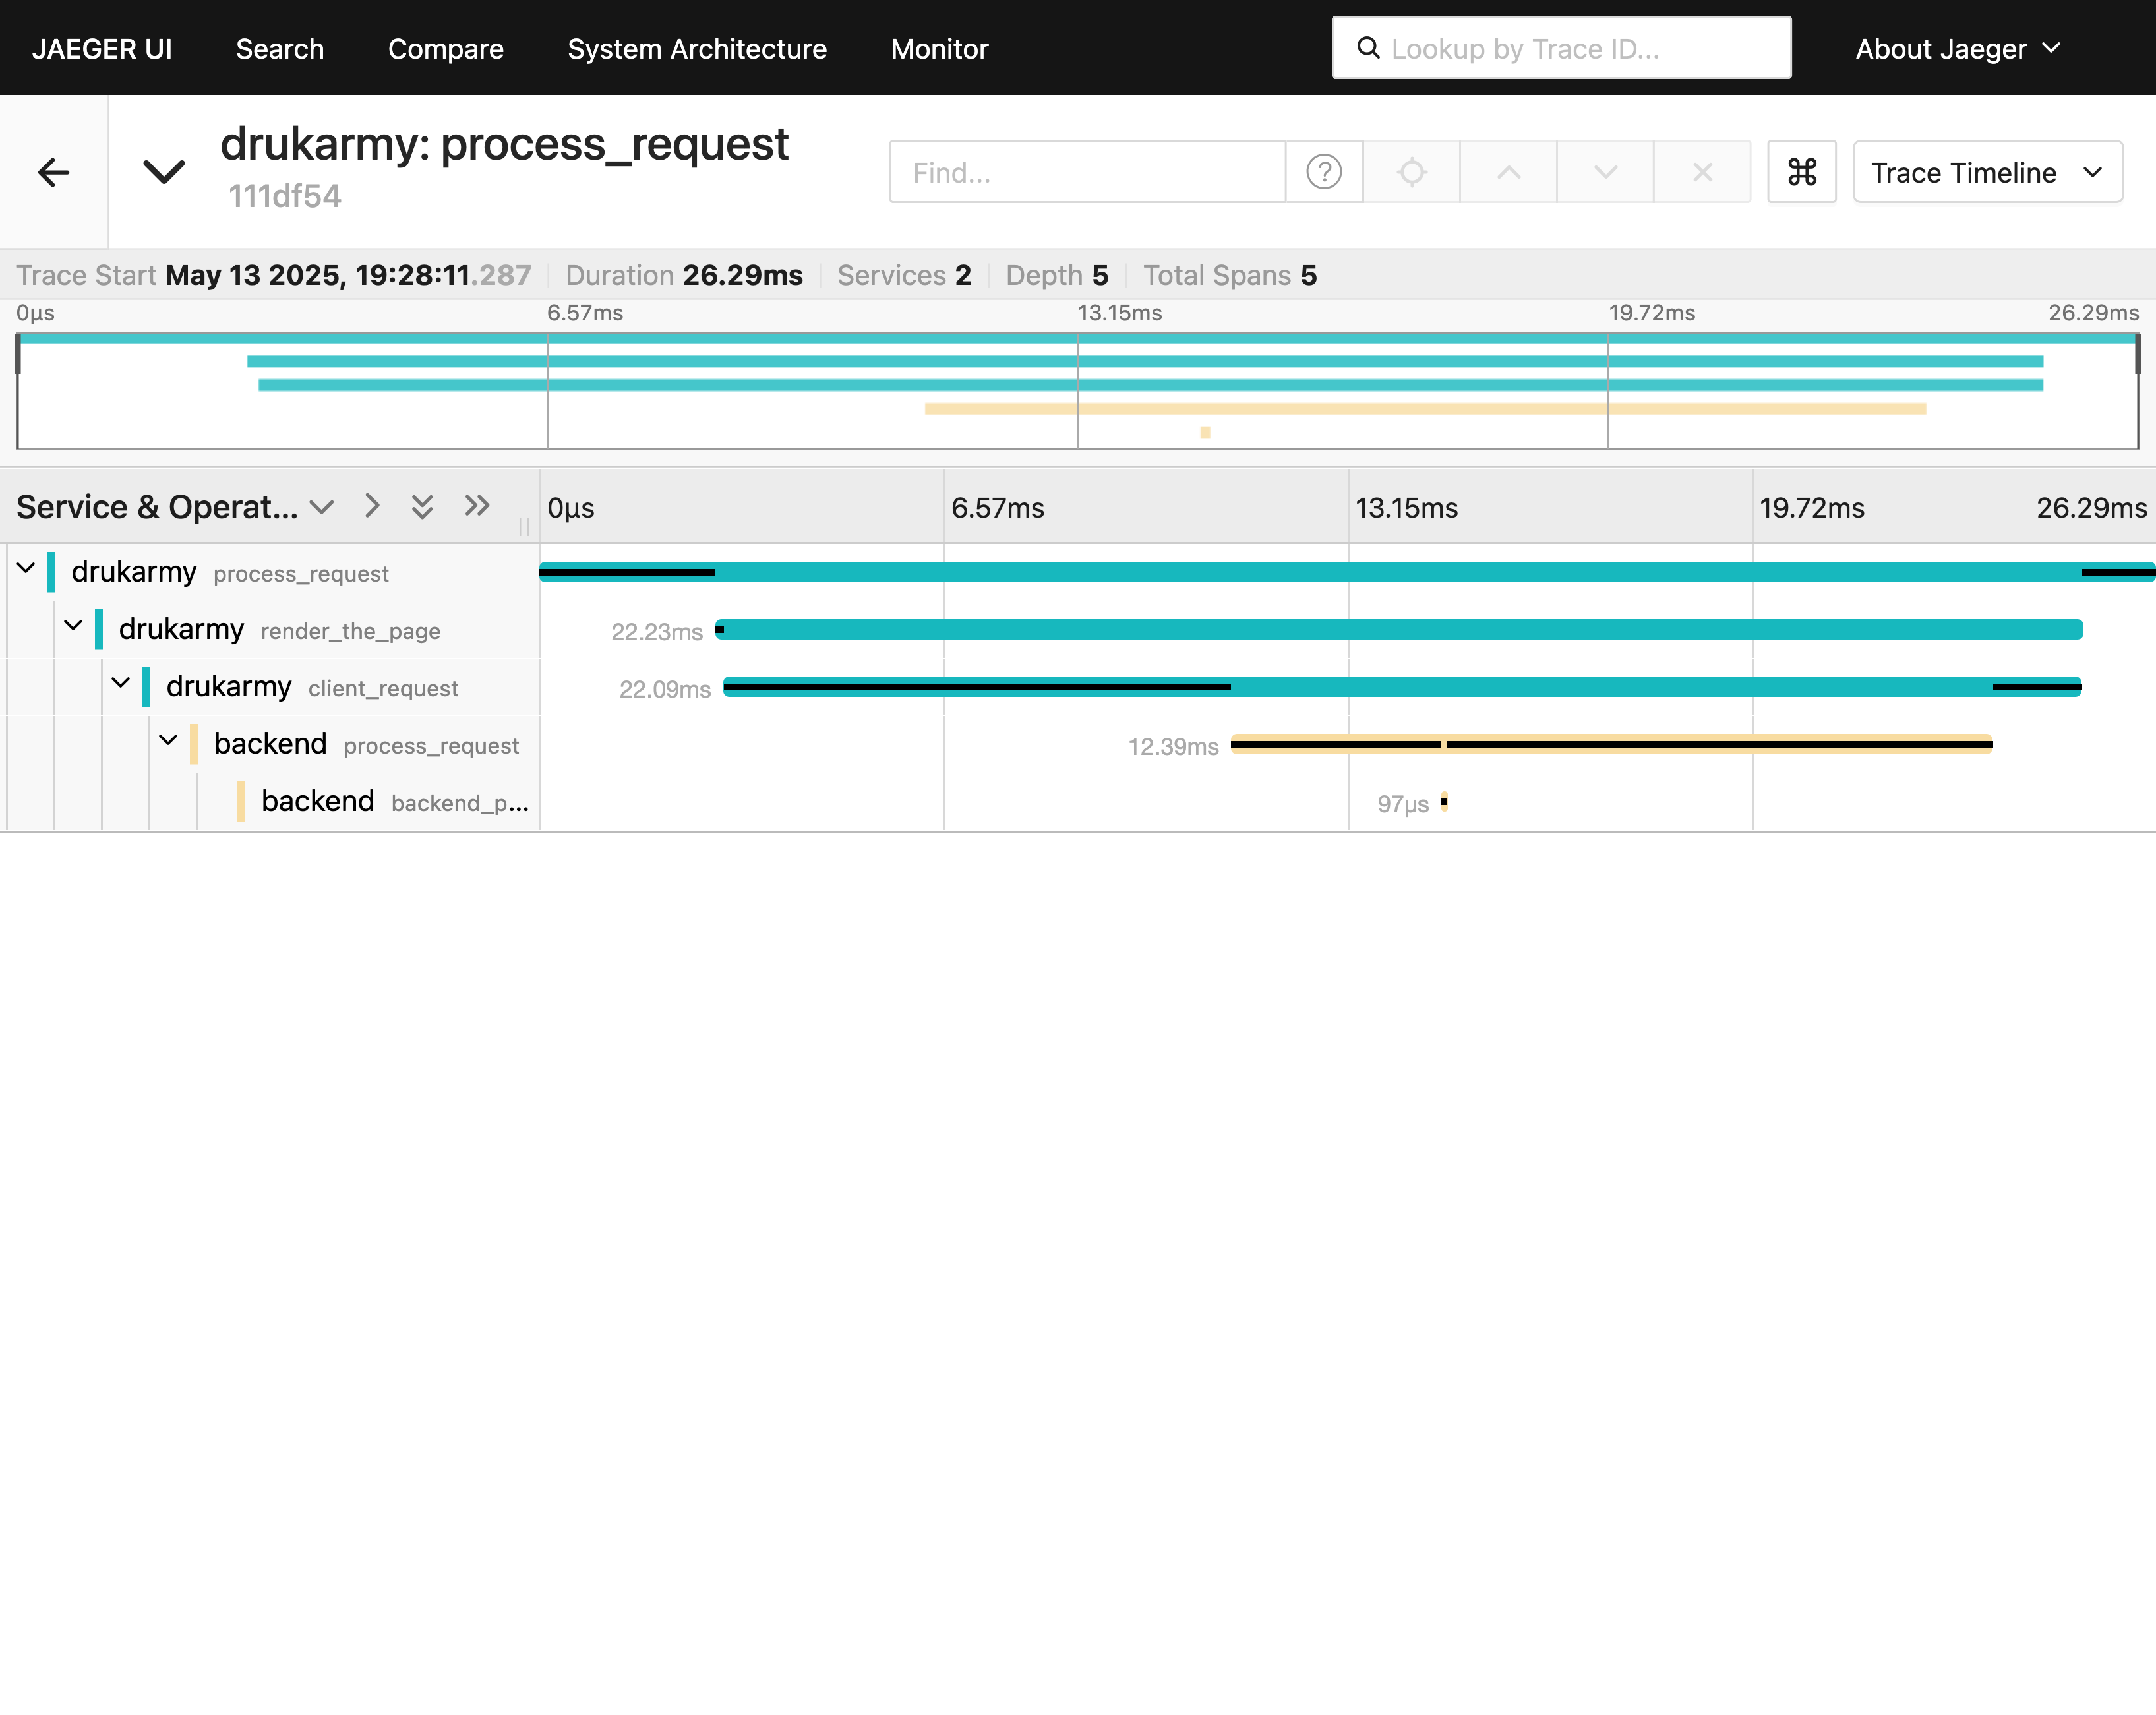
Now, when you run:
curl localhost:8000
You’ll see a fully connected distributed trace in Jaeger that spans both the drukarmy and backend services.
Example Propagation Headers
When the client span from drukarmy calls the backend, it sends:
traceparent: 00-05f1aec8000edfb2caa1c7444e97e4d0-0edfb2caa1000004-01
tracestate:
Here’s what it means:
trace-id:05f1aec8000edfb2caa1c7444e97e4d0→ the shared trace for this requestparent-id:0edfb2caa1000004→ the span from the drukarmy clienttrace-flags:01→ marks the trace as sampled
With this setup complete, Jaeger will show a coherent trace tree with spans from both services correctly linked.
What’s Next?
Now that you have basic and distributed tracing working with OpenTelemetry in a Marten application, here are a few directions to explore next:
- Automated Instrumentation
Use
opentelemetry-instrumentation.cr5 to automatically instrument HTTP server and client requests, reducing the need for manual span management. - Semantic Conventions
Enhance the value of your traces by adopting “OpenTelemetry semantic conventions”7.
These help standardize span attributes such as
http.method,db.system, andmessaging.operation. - Learn More About Tracing in Crystal For a more in-depth guide, check out my previous article: “How to begin with Traces in Crystal”9.